Enter each grading category, its weight from the syllabus, and your current average percentage in that category.
| Total Weight | |||
Course Grade Calculator with Weighted Categories
A course grade calculator with weighted categories applies the weight each category carries in the syllabus to your current score in that category, then sums the weighted contributions. In a course where homework is 20%, the midterm is 25%, the final is 30%, projects are 15%, and participation is 10%, a 90% on homework contributes 18 points to the course grade while a 90% on the final contributes 27 points. High-weight categories dominate. The calculator above takes one row per category, runs the math live, and shows both the projected course grade and the letter on the standard US plus and minus scale.
- Category Score = your current average percentage in the category (0 to 100)
- Category Weight = the percentage that category counts toward the final grade
- When weights sum to exactly 100 the denominator equals 100 and the result is the standard percentage
Class Grade Calculator Mode for Syllabus Categories
Use this mode as a class grade calculator whenever your instructor lists category weights in the syllabus rather than total points. Canvas, Blackboard, Brightspace, and Schoology all expose category weights in the gradebook settings, so the percentages you enter here should match what the LMS reports per category. If your LMS shows a category at 84.6% and the syllabus assigns that category a 25% weight, enter 84.6 and 25. The calculator handles up to roughly a dozen categories on common screens; mobile reflow lets you add as many as you need without horizontal scrolling.
Class Grade Calculator with Weights Worked Example
A class grade calculator with weights walks through this kind of example. Suppose your physics syllabus has homework (20%, current average 92), labs (20%, average 88), midterm (25%, score 81), final (25%, not yet taken), and participation (10%, average 100). Enter the four completed categories; leave the final blank or enter a predicted score. With the final pending, the calculator divides by 75 (total weight entered) and shows your current standing on the completed 75% of the course. Predict the final at 85% and the projection becomes 88.7% (B+); predict 95% and the projection becomes 91.2% (A-). This sensitivity to high-weight scores is why the final usually decides borderline cases.
Course Grade Calculator Points-Based Mode
The Points-Based mode collapses the syllabus into a single total-points scoreboard. Each row is one assignment or one category bucket; you enter the points earned and the points possible. The calculator sums both columns and reports total earned divided by total possible. This matches how a paper-based gradebook works and how many community college and high school instructors run their courses, where every quiz, every homework, and the final all feed into the same denominator without explicit category weights. The Drop Lowest toggle removes the row with the lowest percentage from the calculation when three or more valid rows are entered.
- Points Earned = the points the instructor recorded for that assignment
- Points Possible = the maximum points listed for that assignment on the rubric or LMS
- When Drop Lowest is on, the single weakest row by percentage is excluded from both sums
Credits Grade Calculator and College Course Grade Calculator Variants
The credits grade calculator question that arrives with "how many credits is this worth" is really a GPA question, not a course grade question. Course grade is a percentage from 0 to 100 inside a single class. Credits and quality points combine course letter grades across multiple classes into a 4.0 GPA. Use the GPA calculator after the course grade calculator produces the letter for each course. The college course grade calculator and college class grade calculator workflows are otherwise identical to high school, since both rely on the same weighted-average arithmetic.
Course Calculator Worked Examples by Course Type
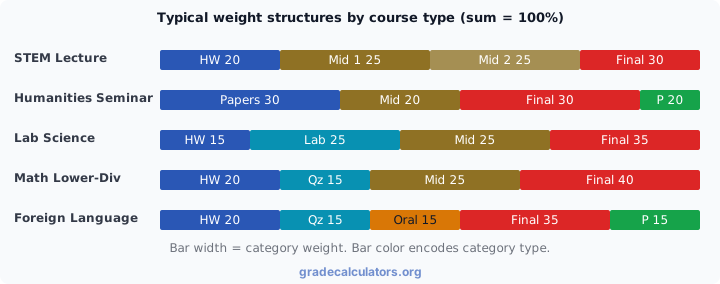
A college course calculator handles different category mixes depending on department. The five rows below are typical weight structures pulled from public syllabi at large US universities. Plug your syllabus into the calculator above to confirm the exact split.
| Course Type | Typical Categories | Common Weight Split |
|---|---|---|
| STEM lecture | Homework, midterms, final, recitation | 20 / 25 / 25 / 30 (two midterms at 25 each) |
| Humanities seminar | Papers, midterm, final, participation | 30 / 20 / 30 / 20 |
| Lab science | Lecture HW, lab reports, midterm, final | 15 / 25 / 25 / 35 |
| Math lower-division | Homework, quizzes, midterm, final | 20 / 15 / 25 / 40 |
| Foreign language | Daily HW, quizzes, oral exam, final, participation | 20 / 15 / 15 / 35 / 15 |
College Class Grade Calculator and the Drop Lowest Policy
Many college class grade calculator users have a "drop lowest" policy in their syllabus. The calculator above honors that policy in Points-Based mode through the Drop Lowest toggle. Turn it on and the lowest-percentage row is removed from both the numerator and the denominator. A 5-quiz course where you scored 8, 9, 7, 6, 10 on a 10-point scale moves from 80% (40 / 50) to 85% (34 / 40) once the 6 is dropped. Verify with your instructor whether the policy drops a percentage row, a points row, or only certain category types; the syllabus is always the authoritative source.
Weighted Class Grade Calculator: When Weights Do Not Sum to 100
A weighted class grade calculator handles two common cases when weights do not total 100%. The first is a partial-semester view: only some categories have grades so far. The calculator divides by the sum of entered weights rather than by 100, which produces an accurate average for the completed portion of the course. The total weight footer turns gray and shows the partial total. The second is intentional extra credit. Some syllabi add a 3-5% bonus category on top of the standard 100%, so the total weight reaches 103 or 105%. The total weight footer turns amber and the calculator allows the projected grade to exceed 100% if the bonus category score is high enough. AACRAO (the national registrars' association) records both patterns as legitimate; confirm the policy in your syllabus before relying on a result above 100%.
Class Grade Calculator by Percentage and by Points
A class grade calculator by percentage uses category weights as the multiplier on each percentage score. A class grade calculator by points sums the raw points earned divided by raw points possible. Both approaches produce the same result when the points distribution exactly matches the published weights. Most LMS gradebooks report the percentage; most paper syllabi state the points. Match the calculator mode to the data you already have rather than translating between the two formats by hand.
Flagship: Course Grade Weight Structures Compared
How to Calculate Grade Affect on Final Class Grade Calculator Output
Students often ask how a single new assignment shifts the projected course grade. The arithmetic is straightforward: each new score moves the running grade toward that score by the category weight share. A 75% on a single homework inside a 20%-weighted category with 10 homework assignments contributes (75 x 20 / 10) = 150 weighted points to the homework category total. Compared to your existing 88% homework average, the homework category drops slightly, and the overall course grade drops by the homework category's 20% weight times the small change. The final exam swings the result far more because no other score divides its weight. Mode 2 of the final grade calculator answers the reverse question: what score on the final is required to hit a target.
Final Course Grade Calculator Planning for Remaining Categories
A final course grade calculator projects the end-of-term result based on completed categories plus a prediction for the remaining ones. Predict each remaining category at a realistic score (your current average is the conservative default) and the calculator projects the term-end grade. Run the projection a second time at your minimum acceptable score and a third time at 100% to see the full plausible range. The middle prediction is usually closest; the spread between the extremes is the upside or downside left on the table.
Course Grade Calculator with Weights Versus the GPA Calculator
The course grade calculator with weights produces a single course percentage (and the matching letter). The GPA calculator takes those letter grades from multiple courses, pairs each with course credits, and produces a 4.0-scale cumulative GPA. Run the course grade calculator once per course to get each letter, then feed those letters and credits into the GPA calculator for the term or cumulative result. The two tools answer different questions: one is a per-class projection, the other a multi-class aggregate.
Tips for Accurate Course Grade Projections
- Verify weights sum to 100% before you trust the result. A syllabus that lists weights totaling 95 or 105% needs clarification with the instructor; the calculator displays the gap explicitly in the total weight row.
- Refresh category averages weekly. A stale mid-semester average misleads the projection. Pull the latest category percentage from Canvas or Blackboard before recalculating.
- Use the calculator for planning, not as the official record. The instructor's final grade calculation is authoritative; the projection above estimates what that number will be based on the inputs you provide.
- Confirm the grading scale with your registrar. The standard US plus and minus scale is common but not universal; some institutions use a flat A / B / C / D / F scale without plus and minus, and a few use non-US scales (the UK grade calculator covers degree classifications).
Authoritative references for course grade methodology: the American Association of Collegiate Registrars and Admissions Officers publishes grading-policy standards used across US institutions; the Carnegie Mellon Eberly Center for Teaching Excellence documents weighted-grade design from the instructor side; the National Center for Education Statistics records institutional grading scales; the College Board publishes letter-grade conversion guidance; and the World Education Services credential evaluation tables underwrite the percentage-to-letter mapping the calculator uses.