| Student | Raw Score | Original % | Curved % | Letter | Remove |
|---|---|---|---|---|---|
How This Grade Curve Calculator Works
A grade curve calculator takes a list of raw test scores and applies a mathematical adjustment to shift the distribution upward or reshape it. Teachers curve tests when a question turned out to be ambiguous or when the raw class average fell well below the department's expected benchmark. Students sometimes run curves on their own scores to preview what a realistic adjustment would look like before asking an instructor to consider one.
This calculator implements the four curving methods in widest use across US high schools and universities. Each method has its own rationale and its own trade-offs. Enter points possible and your class roster in the widget above, then switch between methods with the dropdown to compare outcomes side by side. The stat summary below the table updates live as you type. No Calculate button is needed.
Four Grade Curving Methods: Grading on a Curve Calculator Comparison
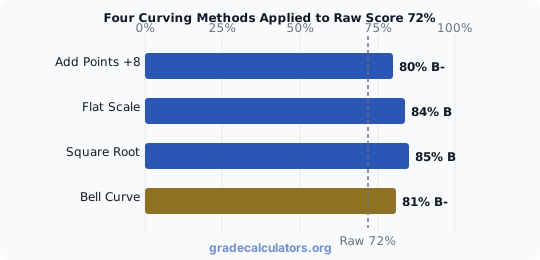
The chart below shows all four methods applied to a student with a raw score of 72%. The dashed line marks the original score. Each method lifts the score by a different amount and crosses a different letter-grade boundary.
Method 1: Add Points (Flat Shift)
Curved % = Raw % + N
- N = percentage points added to every score (capped at 100)
- Raw % = (points earned / points possible) x 100
This is the most transparent curve and usually the easiest to defend. Every student moves the same amount, so rank order is preserved exactly. The trade-off: students already at or near 100% raw see no benefit, so anyone at the ceiling effectively receives less reward than the middle of the class.
Method 2: Flat Scale (Highest to 100%)
- Max(Raw %) = the highest raw percentage in the class
- Curved % = Raw % + Delta (capped at 100)
Flat scaling is popular in STEM courses because it rewards the top performer with a clean 100% while still lifting the class. The curve size is tied to how hard the test actually was. It isn't appropriate when the top student is an outlier far above the rest of the class; a single 98% raw with everyone else at 55% leaves a 2-point curve that helps almost no one.
Method 3: Square Root Curve
Curved % = sqrt(Raw %) x 10
- Raw % = original percentage (0 to 100)
- Non-linear: low scores rise the most, high scores barely move
Square root curves rescue low performers without inflating the top of the class. Professors use them when a handful of students failed dramatically but the median student did acceptably. The formula compresses the bottom of the distribution upward, so a small raw difference below the median translates to several curved points, while a small raw difference above the median is nearly imperceptible.
Method 4: Grading on a Bell Curve Calculator (Bell Curve Grade Calculator)
- ClassMean = average of raw percentages
- ClassStdDev = standard deviation of raw percentages
- TargetMean = desired curved mean (default 80)
- TargetStdDev = desired curved spread (default 10)
Grading on a bell curve forces a known distribution regardless of raw difficulty. It's how many law schools, graduate seminars, and large-lecture weed-out courses handle grading because it guarantees a predictable fraction of each grade tier. The trade-off: a student's letter depends not on what they knew but on how many classmates knew less. Most US high schools avoid bell curving for that reason.
How Curving Affects Letter Grades and GPA
The grade-boundary effect is the most practically important output of a curve: a few percentage points can push a student across a letter-grade line, which changes the GPA points earned for that course. This is the signal that neither the raw score nor the curved percentage alone makes obvious.
Consider a student with a raw 72% (C-, 1.7 GPA points on the standard 4.0 scale). Each curving method from the chart above produces a different letter-grade and GPA outcome:
- No curve (72%): C- (1.7 GPA points)
- Add Points +8 (80%): B- (2.7 GPA points) - one full letter grade jump, +1.0 GPA point
- Flat Scale +12 (84%): B (3.0 GPA points) - one and a half letter grades, +1.3 GPA points
- Square Root (84.9%): B (3.0 GPA points) - same letter as Flat Scale, slightly different percentage
- Bell Curve to 81%: B- (2.7 GPA points) - same letter outcome as Add Points in this example
For a student near the C-to-B boundary, all four methods here deliver at least a B-. A raw 89% (B+, 3.3 GPA points) with a flat +8 curve reaches 97% (A+, 4.0 GPA points), a meaningful GPA shift. Students already above 92% raw see no letter-grade change from an additive curve because they're already in the A range. The letter-grade reference in the calculator widget shows the full scale; expand it to see which boundary a specific curved score crosses.
To convert curved letter grades into semester or cumulative GPA, use the GPA calculator after running the curve. Enter each student's curved letter and credit hours to see the per-student GPA impact of the chosen method.
Class Curve Calculator: Worked Example with an Exam Curve Calculator Walkthrough
A physics midterm out of 100 returned these raw scores: 55, 62, 68, 71, 74, 78, 82, 88, 91, 94. The class average is 76.3% and the instructor wants to lift the average to 80%.
Add Points method: Add 3.7 points to every score. New distribution: 58.7, 65.7, 71.7, 74.7, 77.7, 81.7, 85.7, 91.7, 94.7, 97.7. Class average is 80.0%. Rank order is unchanged. The top student moves from 94 to 97.7 (A+) rather than all the way to 100.
Flat Scale method: Top score is 94, delta is 6. New distribution: 61, 68, 74, 77, 80, 84, 88, 94, 97, 100. Class average is 82.3% and the top student earns a clean 100% (A+). The bottom student moves only 6 points, less than the additive 3.7 approach would deliver if the target were 80.
Square Root method: Raw 55% becomes 74.2% (C), 71% becomes 84.3% (B), 94% becomes 96.9% (A). Failing students are rescued aggressively and the top of the class barely shifts. Class average lands near 87%.
Enter these ten scores into the calculator above to compare all four methods in the stat summary and table. Switching methods via the dropdown lets you see how each one changes the class distribution before you commit.
Curving Grades Calculator Tips for Class Use
These five practices reduce student confusion when you apply a curve mid-semester.
- Publish the method before returning scores. Students cope with curves far better when the method is announced in advance. Use the stat summary output from this calculator to communicate the before and after averages clearly.
- Avoid mixing methods across tests in the same course. Consistency matters more than optimization. Pick a curving policy at the start of the semester and apply it uniformly; students plan their study effort around the grading structure.
- Watch for ceiling and floor effects. Adding points above 100% is silently clamped by this calculator. If several students are already at or near 100% raw, an additive curve gives them less lift than the median student; switch to a square root curve instead.
- Do not curve routine weekly quizzes. Curves signal that something went wrong with a specific assessment. Curving every quiz teaches students that raw scores do not matter, which undermines the signal value of formative assessment.
- Check department policy before using bell curving. Many departments and institutions have explicit policies about forced distributions. A bell curve with a small class (fewer than 15 students) can produce wildly unfair outcomes because the standard deviation is unstable on small samples.
When Not to Use a Curve Grades Calculator or Grading on the Curve Calculator
Curving is the wrong solution when:
- The class average was low because the content was not taught adequately. Reteach instead.
- The test had a broken or ambiguous question. Remove the question and re-scale, rather than curving the whole test.
- You want to raise one specific student's grade. That is a regrade conversation, not a class-wide curve.
- A curve would push the course grade distribution outside department norms. Confirm the policy before publishing.
- The class is too small for a bell curve. With fewer than 15 students, sample standard deviation is too volatile to produce a reliable z-score reshaping.
For raw percentage calculations before curving, use the test grade calculator to compute each student's point-to-percent conversion. For a course-wide view that combines many assignments rather than a single curved test, use the grade calculator. Statistical curving conventions referenced here follow the distribution definitions documented by the National Center for Education Statistics and the College Board Research.
Always verify with your specific school's registrar before publishing curved grades to the official transcript system. Curving policies vary by institution and department.